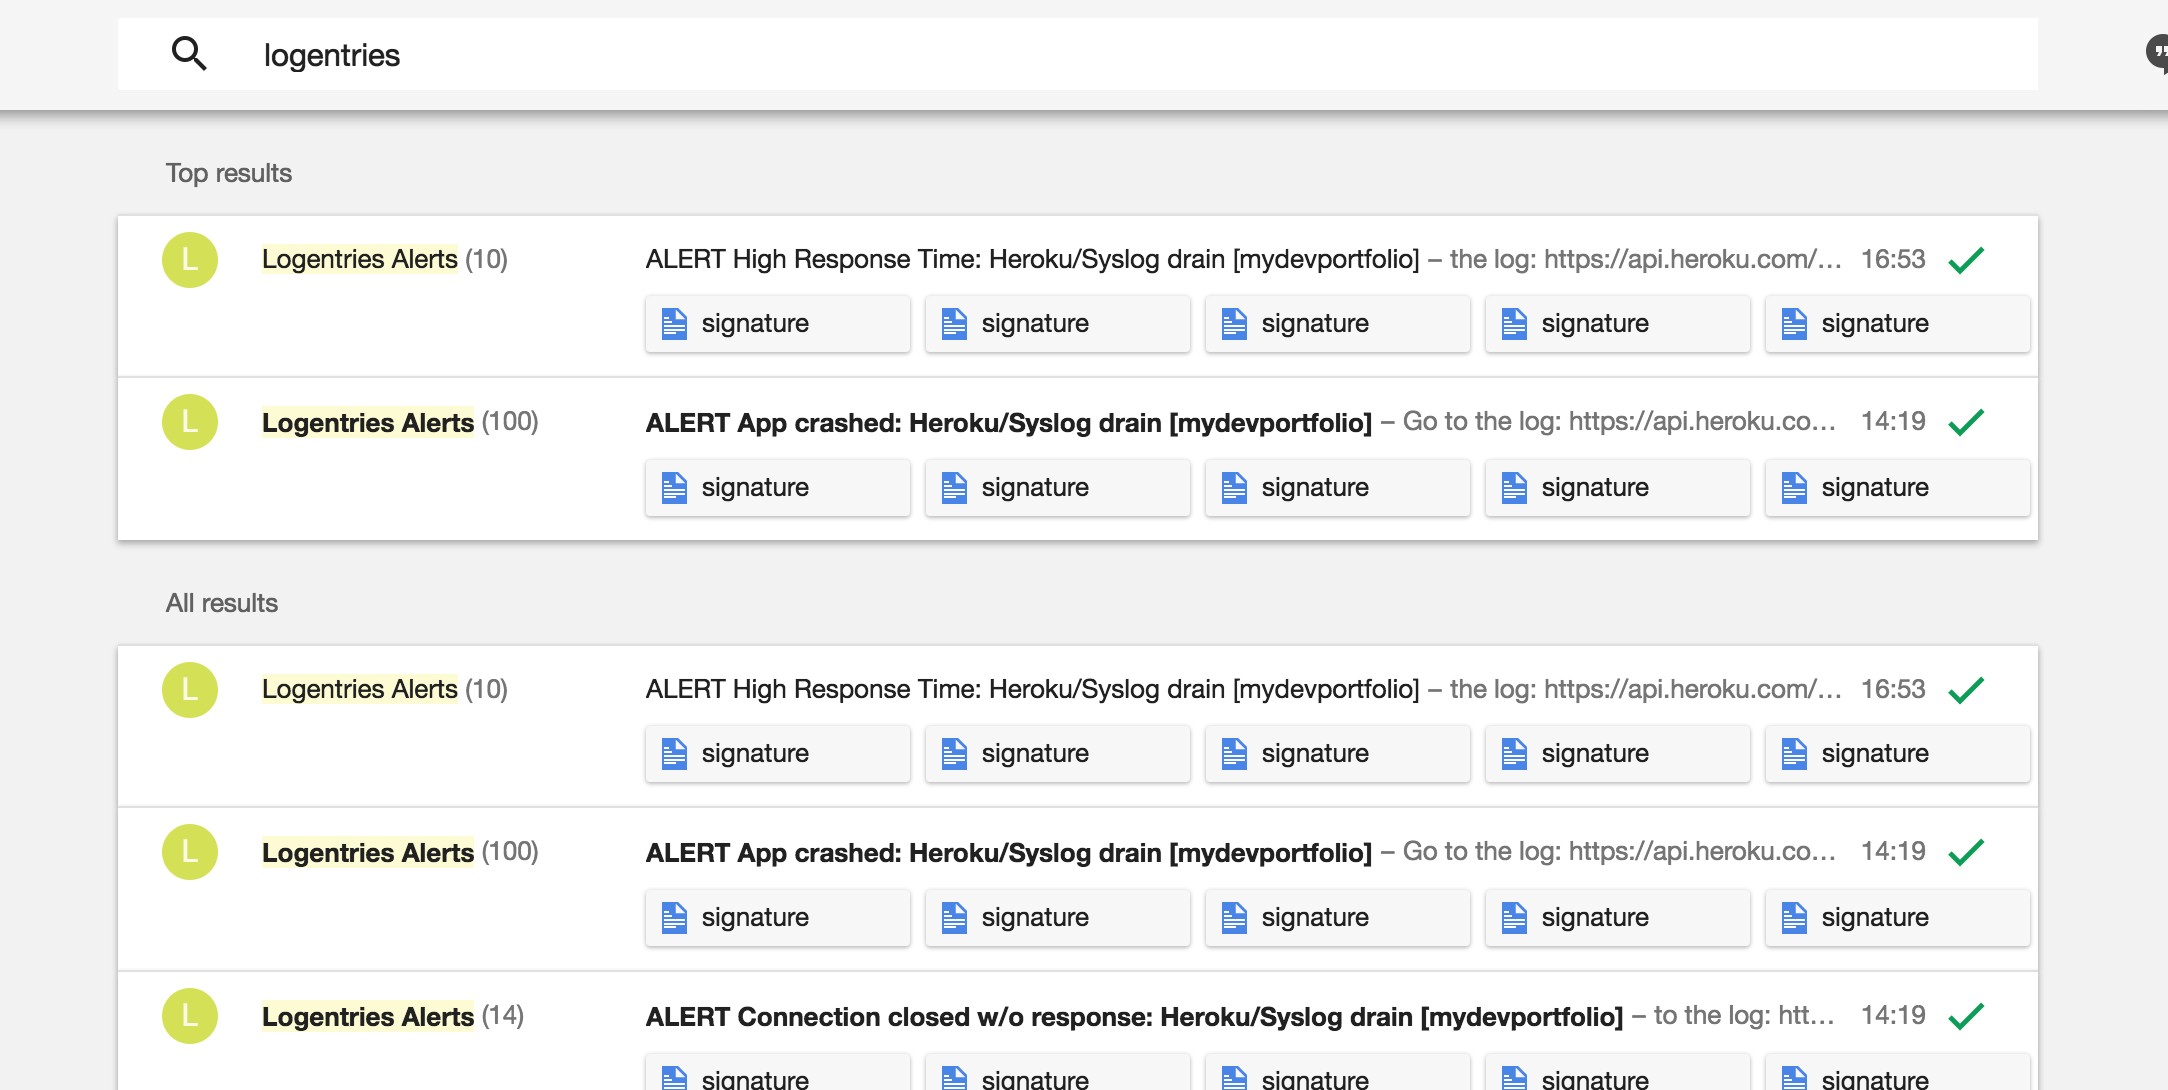
I run a side project that helps developers and programmers build portfolios based on their Github projects: mydevportfol.io. Recently, it's not been running very well...

Performance is critical for ecommerce website, but it's even more critical when your audience is a group of discerning developers. It doesn't inspire confidence in them when the app they're using is slow.
So, I had to figure this out. I had the default logging in Heroku and hooked up to Logentries, but I needed more info.
I'm doing some operations on the API side that are slowing down the responses, but I didn't know which one. So, some Javascript to the rescue.
Here's the boilerplate I came up with.
let startTime = (new Date).getTime();

let endTime = (new Date).getTime();

let logObject = {
    "path": "/build",
    "userAction": "site-build",
    "appAction": "upload file to Firebase",
    "functionTime": endTime - startTime
}

log.info(logObject);
At the start of a function or request, I'd kick off the startTime.
After the function has done its thing, I define the endTime.
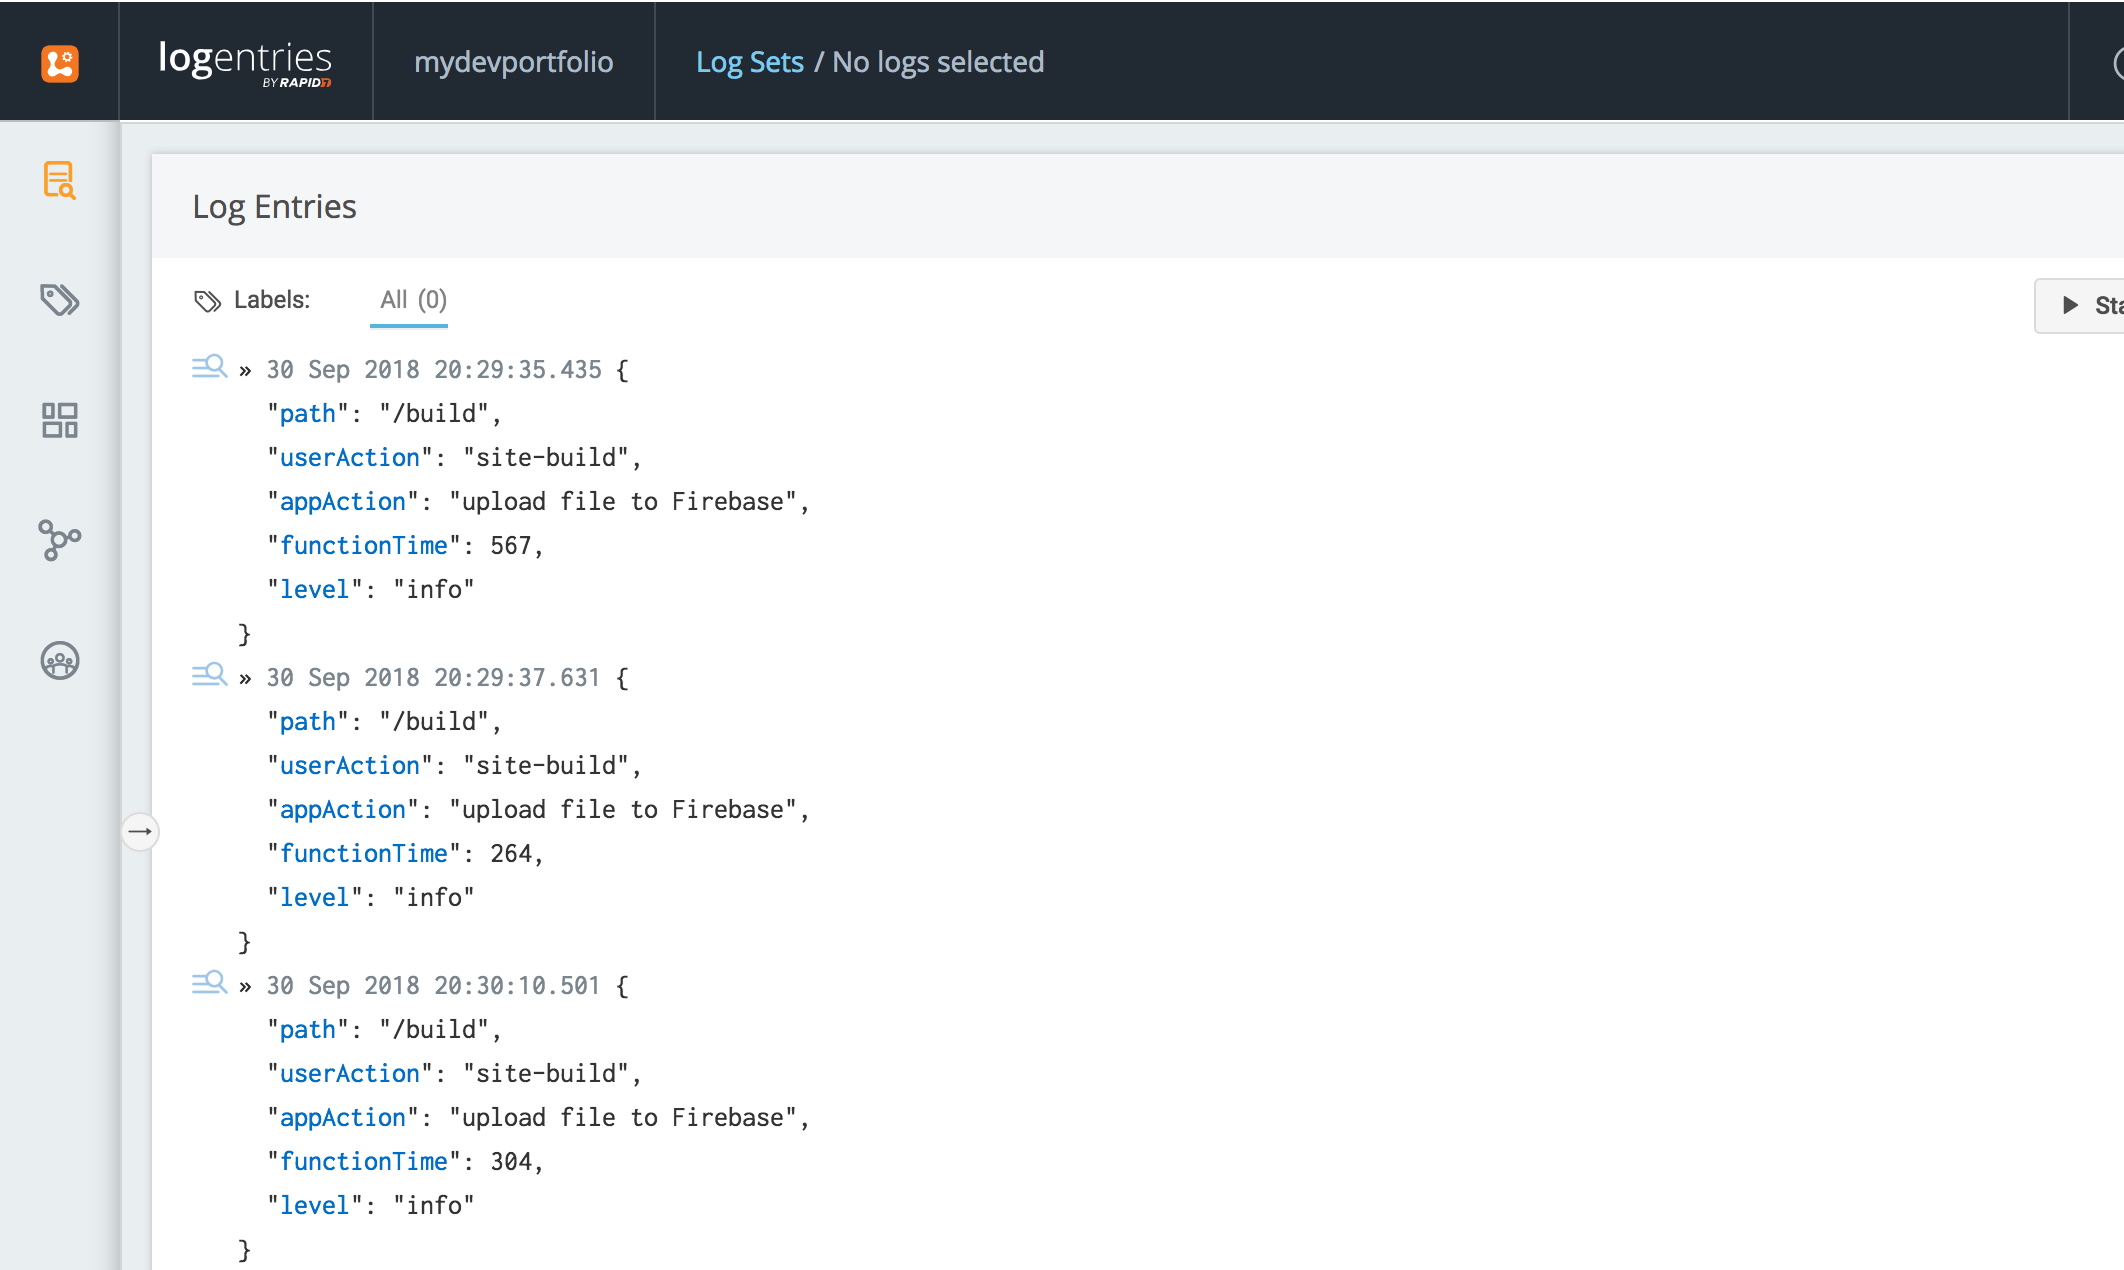
Then, I'm sending that info to Logentries, so that I can query the logs per userAction, appAction, functionTime and path.
The result?
I've figured out what the slow function is. Every time a site is generated I'm uploading it to a Firebase storage location. It seems this can take some time...

What do you think of my approach? Does it make sense?
Would love to hear your thoughts.
